| Version 43 (modified by , 18 years ago) (diff) |
|---|
Track Catalog
-
Track Catalog
- Overview Track
- Ruler and Zooming Tracks
- Base Color Track
- GC Content Track
- Predicted Gene Track
- 5’SAGE Track
- Sequence Quality Track
- Coverage Track
- Fosmid End Track
- Bac End Track
- Genetic Marker Tracks
- Repeat Element Track
- HNI alignment Track
- Ensembel Predicted gene Track
- Homology Track
- Chromosome Overview
- Medaka Trasncripts
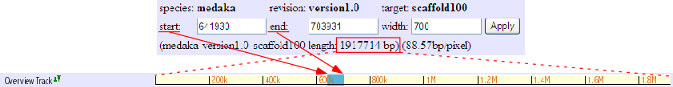
Overview Track

This track shows the range of present displayed window in the total genome. In above image, for instance, the blue-colored viewpoint shows the range from 125kb to 145kb. Clicking on any position of this overview track moves the viewpoint the middle position. For example, when you click on around 100k positions, the viewpoint will move to 90k-110k.
Ruler and Zooming Tracks


Both the ruler track and the zooming track are displaying same contents with different color. These two show the base position number of the present displayed content with respect to the total sequence. If you click any position of the ruler track, the viewpoint will move to the middle position. For example, if the rightmost end of the ruler track is clicked then the same effect will be happed as the ff.png button of main screen is pressed. Before using the zoom button on main screen, it is better to have the required region on middle position by using the ruler track to smoothing future enlarge processing.
In addition to the effect of the ruler track, if you click any position on the zooming track then two times zoom will be happened. For example, it is same to click the central button on zoom track as the zoomin.png button on main screen. On the other hand, it is also same to clicking the rightmost end of the zooming track as click ff.png then click zoomin.png on main screen. This track is useful to zoom out our interested region on the sequence..
Base Color Track


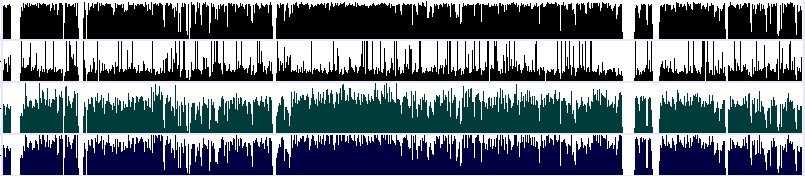
Base color track changes the sequence to color mode. All four ATGC bases are displayed by converting to the individual color. It is natural to display each base pair by one pixel. By zooming in, you can see any specific region of the sequence in alphabet symbol (above bottom image).
It is also possible to customize the corresponding base pair color also. For example, if GC base pair are only colored then we can use it as a simple GC content track. To get the sequence itself, it is better to save from fasta track.
GC Content Track

This track displays the ratio of GC contents for 5 pixels. If the pixel number of a base pair is more than 5, the coloring will be done to tell whether it is GC or AT.
Predicted Gene Track

This track displays the medaka predicted genes as Mapped gene track. It is viewed on lines, where the exons parts are on rectangular shape. Arrow sign shows the plus or minus strand of the genome.
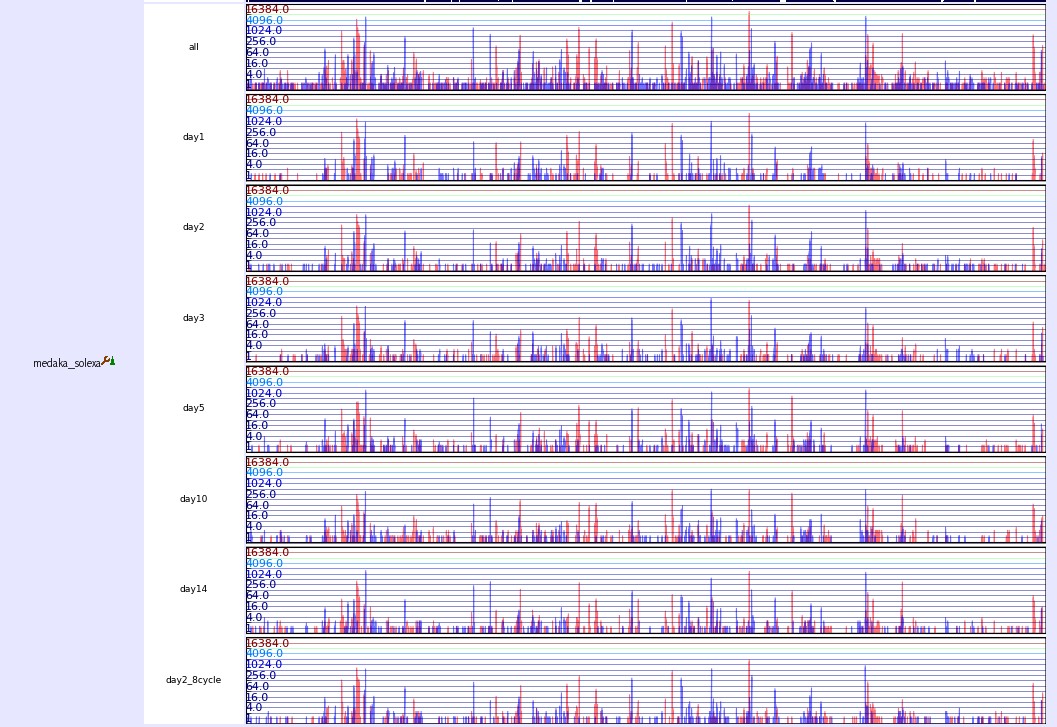
5’SAGE Track

This track displays the medaka expression profile by showing mapped 5’end tag of an expressed Gene. Details of each tag can be found by clicking on each viewed rectangle on this track.
Sequence Quality Track

This track presents the quality value of medaka assembled sequences. The quality value of a subsequence in a scaffold can be viewed by inserting sequence’s scaffold name and location on main window.
Coverage Track

This track displays coverage ratio of a specific sequence from a scaffold, determined by aligning Plasmid read sequence on genome.
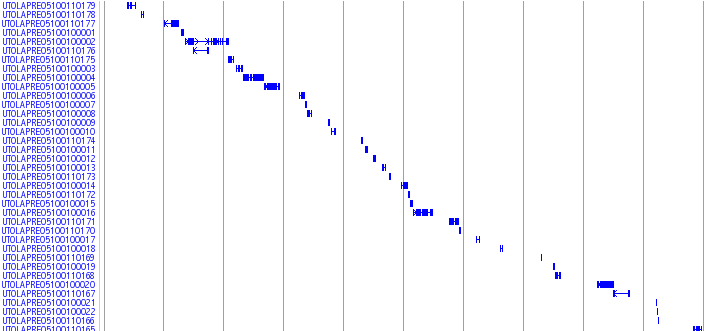
Fosmid End Track
About 37.5 kb length Fosmids were obtained at the National Institute of Genetics (NIG,Japan). Finally, 217,344 fosmid end pairs (11.1 x clone coverage) successfully located on the genome. Mapped fosmid is viewed in UTGB(medaka) main window named as “Fosmid end Track”

This track displays all the mapped fosmid reads obtained at the National Institute of Genetics(NIG,Japan) by using rectangular box in a line.
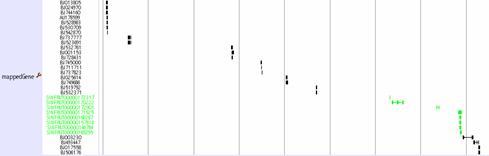
Bac End Track
A total of 142,414 bacterial artificial chromosome (BAC) end sequences are mapped to medaka genome. Three types of BAC library are of average size 135, 180, and 210 kb are used. The accession numbers of the reference BAC sequences are AB102768, BA000027, AB251575, and AB232918-24, respectively. To reduce computation time, the assembly was aligned against each reference BAC using BLAT with the default parameters, and the scaffold that was most similar to the reference was selected. The selected scaffold was then aligned to the reference BAC using NCBI-BLAST (The parameters were all default, except the e-value threshold was set to 1e-10)

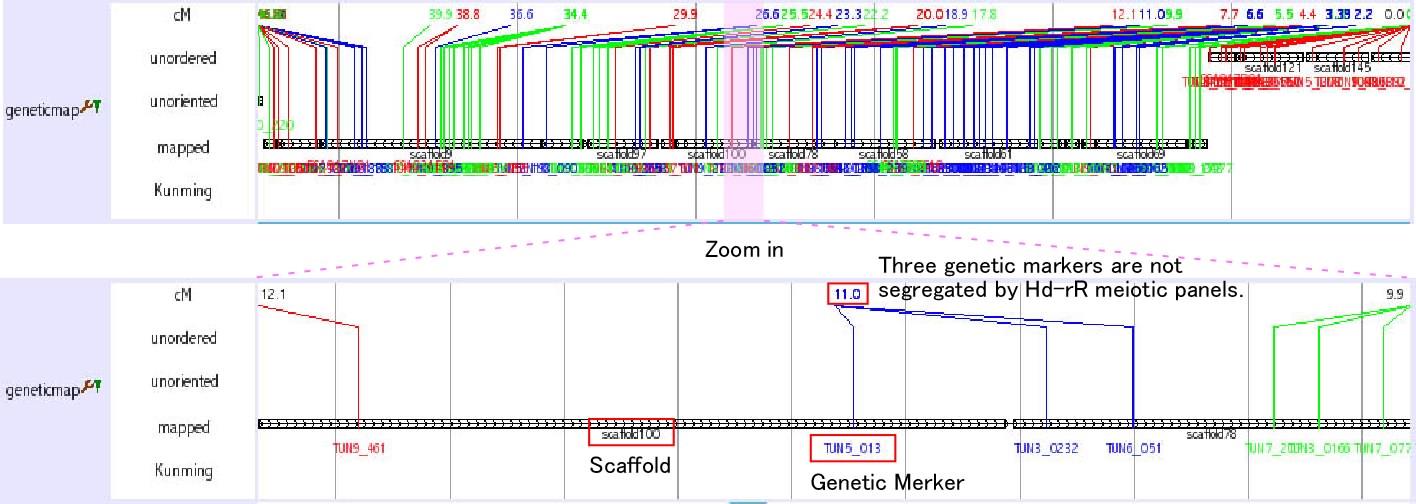
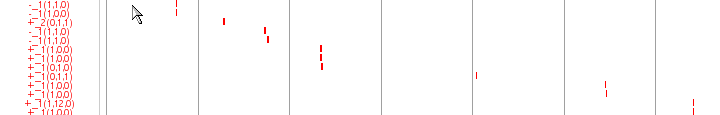
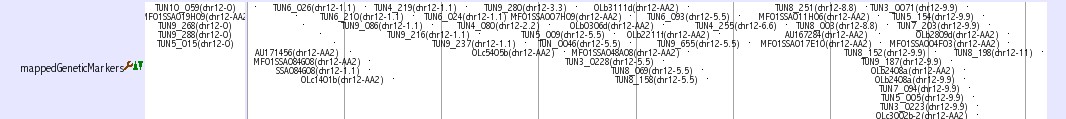
Genetic Marker Tracks
Three tracks provide genetic marker information of medaka genome.
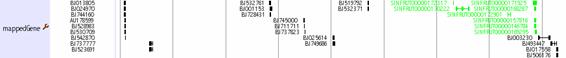
Mbase marker (1) This track shows genetic markers which are shown in the Mbase in Prof. Mitani lab. Click on an individual marker within a track opens a link to Mbase.

mappedGeneticMarkers (2, 3) This track shows genetic markers whuch are used in medaka genome project. Click on an individual marker within a track opens a typing panel using Hd-rR/HNI female backcross panel

SSLP Marker (4) This track shows 382 uniquely mapped SSLP (simple sequence length polymorphism) markers. Click on an individual marker within a track opens a details page containing primer sequences.

The details of these tracks are described here: http://medaka3.utgenome.org/~kobayashi/UTGBmedakaHELP/GneticMarkers.html
Reference: (1) Naruse et al., Genetics 154:1773-1784 (2000) (2) Kimura et al., Mech. Dev. 121:915-32 (2004) (3) Kimura et al., Gene 363 24-31 (2005) (4) Kasahara et al., Nature 447:714-719 (2007)
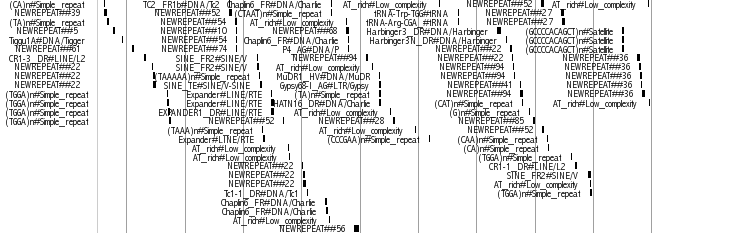
Repeat Element Track

This track displays all the repeat elements in medaka genome fixed by repeatmasker (ref), RepBase?(ref) and de novo repeat finding tool(ref). The repeat element’s region is displayed by a rectangular box.
HNI alignment Track

This track displays all the polymorphisms regions between medaka Hd-rR and HNI strain. The details of this track is described here: http://medaka3.utgenome.org/~ssksn/HNI_SNPs/common/HNI_SNPs_description.html
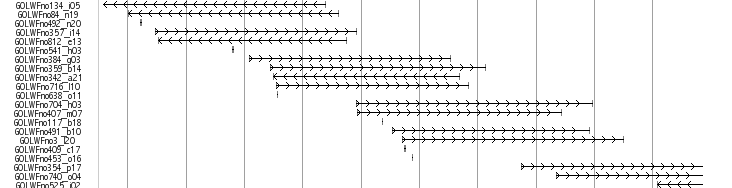
Ensembel Predicted gene Track

This track displays medaka genes predicted on Ensembel(ref) pipe line. The gene region is displayed by line and the bac ends are shown in rectangular box. The arrow sign shows the plus or minus strand of the genome.
This track is an alias of the Ensembl transcript model predictions in http://www.ensembl.org/Oryzias_latipes/index.html Ensembl Medaka. The mapping region for the gene is displayed by line and the exons are shown in rectangular box. The arrow shows the direction of the predicted transcript.
The current data sources are Ensembl44.
Click each transcript for more imformation in Ensembl.
Homology Track

Homologues genes of medaka-human, medaka-zebrafish, medaka-tetraodon, medaka-fugu are displayed in different tracks.
- EnsemblZFHomo: Zebrafish homologue
- EnsemblMouseHomo: Mouse homologue
- EnsemblHumanHomo: Human homologue
- EnsemblFuguHomo: Fugu homologue
- EnsemblTetraodonHomo: Tetraodon homologue
These track show olthologous genes, which are a result of the Ensembl homologue prediction. The current data source is Ensembl44.
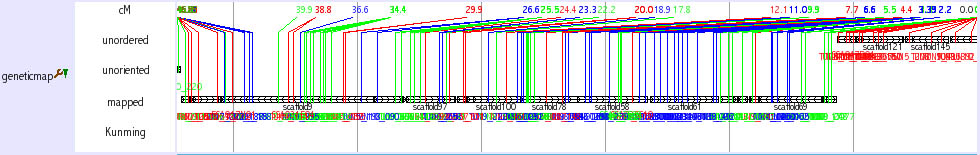
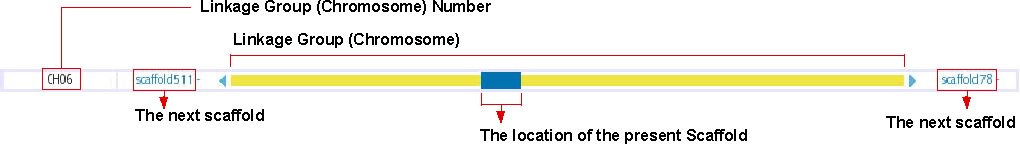
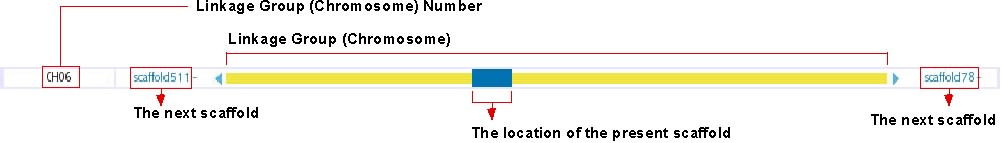
Chromosome Overview

This track shows the location of presently displayed scaffold on the chromosome. In the above image, for instance, the blue-colored box shows the position of scaffold100 on chromosome 6, which is represented in the yellow bar. Click on any position of this track will bring you to the chromosome view (see below). The next scaffolds are indicated at the both end of yellow bar. Click on the scaffold name shown in light blue to move to the view of the corresponding scaffold.
The details of this track is described here: http://medaka3.utgenome.org/~kobayashi/UTGBmedakaHELP/ChromosomeOverView.html
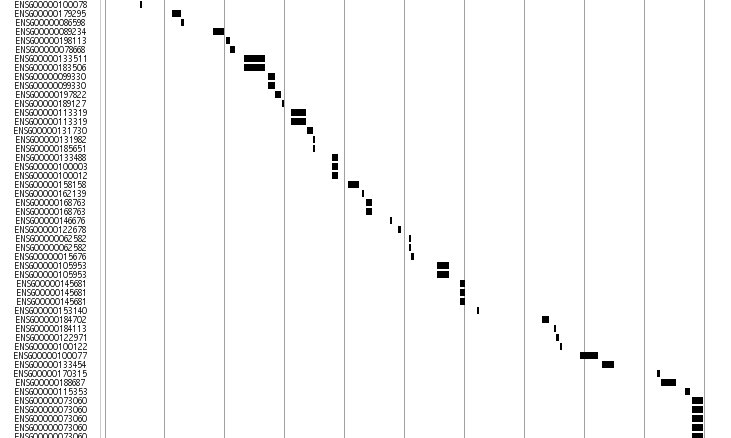
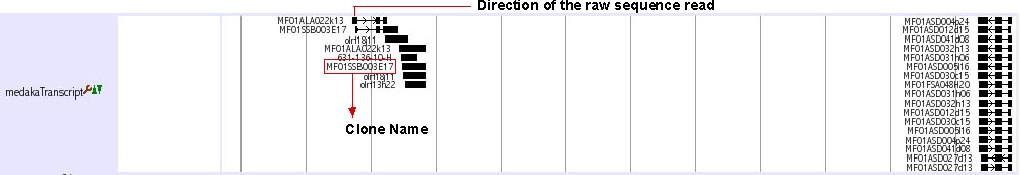
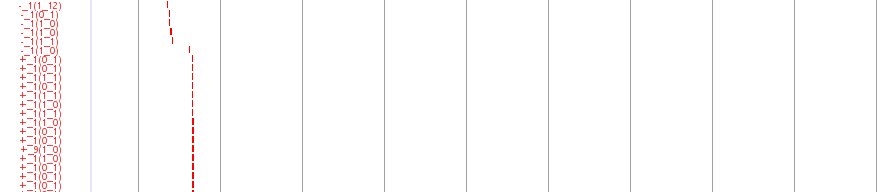
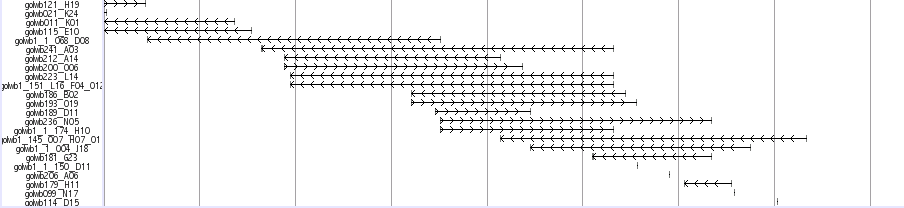
Medaka Trasncripts
![]()
This track shows a total set of medaka transcripts from Unigne database build#19 in ncbi. Transcripts are initially aligned using BLASTN and listed the scaffolds which show the best match. The final alignments were produced between transcrips and the selected scaffolds using sim4, a program to align cDNA and genomic DNA (ref. 1). In some case, transcripts are mapped to unexpectedlly huge region because of the low complexity sequences in the transcripts. We eliminated these regions when the mapped region is over 200 kb.
Black-colored boxes indicate aligned regions and bars indicate gaps. Arrows indicate the transcription directions. Click on each transcript opens a link to the information in the NCBI nucleotide database.
ESTs and mRNAs are represented by the clone names and gi numbers, respectively.
Reference:
- Florea,L., Hartzell,G., Zhang,Z., Rubin,G.M. and Miller,W. (1998) Computer program for aligning a cDNA sequence with a genomic DNA sequence. Genome Res., 8: 967.974.
Attachments (57)
- MedakaTrasncripts.html (1.5 KB) - added by 18 years ago.
- ChromosomeOverView.html (1.3 KB) - added by 18 years ago.
- ChrView2.jpg (155.5 KB) - added by 18 years ago.
- ChrView.jpg (78.7 KB) - added by 18 years ago.
- ChrViewZoom.jpg (36.2 KB) - added by 18 years ago.
- EnsenblPredGene.html (898 bytes) - added by 18 years ago.
- GeneticMappingPanel & Markers.html (4.8 KB) - added by 18 years ago.
- GeneticMappingPanel & Markers.2.html (4.8 KB) - added by 18 years ago.
- EST_libraries.htm (8.2 KB) - added by 18 years ago.
- image028.jpg (3.3 KB) - added by 18 years ago.
- image029.jpg (2.2 KB) - added by 18 years ago.
- image030.jpg (2.1 KB) - added by 18 years ago.
- image031.jpg (742 bytes) - added by 18 years ago.
- image034.jpg (976 bytes) - added by 18 years ago.
- image035.jpg (3.5 KB) - added by 18 years ago.
- image036.jpg (5.9 KB) - added by 18 years ago.
- image037.jpg (29.4 KB) - added by 18 years ago.
- image038.jpg (7.0 KB) - added by 18 years ago.
- image039.jpg (4.8 KB) - added by 18 years ago.
- image040.jpg (1.8 KB) - added by 18 years ago.
- image032.jpg (3.0 KB) - added by 18 years ago.
- image033.jpg (3.0 KB) - added by 18 years ago.
- track_overview.png (3.3 KB) - added by 18 years ago.
- 5sage.png (243.2 KB) - added by 18 years ago.
- bac.png (610.5 KB) - added by 18 years ago.
- coverage.png (78.6 KB) - added by 18 years ago.
- fosmid.png (404.1 KB) - added by 18 years ago.
- homo.png (940.0 KB) - added by 18 years ago.
- pred.png (697.8 KB) - added by 18 years ago.
- qv.png (83.0 KB) - added by 18 years ago.
- repeat.png (511.7 KB) - added by 18 years ago.
- hni.png (26.9 KB) - added by 18 years ago.
- EnTra.jpg (17.7 KB) - added by 18 years ago.
- Entra.jpg (17.7 KB) - added by 18 years ago.
- Entra.2.jpg (59.1 KB) - added by 18 years ago.
- geneticmarker.jpg (39.7 KB) - added by 18 years ago.
- MedakaTranscriptsSc150.jpg (31.2 KB) - added by 18 years ago.
- homo.jpg (77.9 KB) - added by 18 years ago.
- SSLP.jpg (8.5 KB) - added by 18 years ago.
- Mbase.jpg (15.3 KB) - added by 18 years ago.
- ff.png (183 bytes) - added by 18 years ago.
- OverView.png (27.7 KB) - added by 18 years ago.
- chr_scroll.2.jpg (372.0 KB) - added by 18 years ago.
- chr_scroll.jpg (265.0 KB) - added by 18 years ago.
- ChromosomeOverView.jpg (25.9 KB) - added by 18 years ago.
- Mutant.jpg (5.0 KB) - added by 18 years ago.
- ChromosomeOverView2.jpg (24.9 KB) - added by 18 years ago.
- ChromosomeOverView3.jpg (24.9 KB) - added by 18 years ago.
-
5sagenew.jpg (11.1 KB) - added by 18 years ago.
5psage track file
- BAC.png (14.4 KB) - added by 18 years ago.
- BAC2.png (14.4 KB) - added by 18 years ago.
-
expression.jpg (219.5 KB) - added by 18 years ago.
Expression track image
- nucleosome.jpg (61.8 KB) - added by 18 years ago.
- nucelosome.2.jpg (73.5 KB) - added by 18 years ago.
- nucelosome.jpg (73.5 KB) - added by 18 years ago.
- nucelo.jpg (73.5 KB) - added by 18 years ago.
-
nucleosome.2.jpg (23.1 KB) - added by 18 years ago.
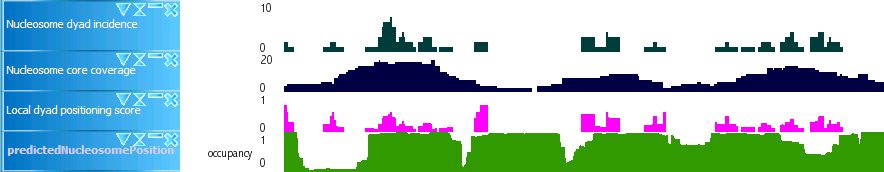
Sample of nucleosome tracks