Track Catalog
-
Track Catalog
- Zooming Track
- Overview Track
- Chromosome Overview
- Base Color Track
- Ruler Track
- Quality Value Track
- Coverage Track
- GC Content Track
- Repeat Masker Track
- Bac End Track
- Fosmid End Track
- Genetic Marker Tracks
- HNI alignment Track
- 5’SAGE Track
- Predicted Gene Track
- Medaka Trasncripts
- Ensembel Predicted gene Track
- Mutant_Track
- Chromosomal view (genetic map)
- Nucleosome
- Expression
Zooming Track

Both the ruler track and the zooming track are displaying same contents with different color. These two show the base position number of the present displayed content with respect to the total sequence.
If you click any position on the zooming track, clicked position will be centered and zoom in the region two times.
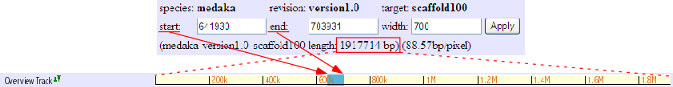
Overview Track

This track shows the location of presently displayed region on the scaffold. In the above image, for instance, the blue-colored box shows the displaying region (start: 641930, end: 703931) on the scaffold 100 of 1917714 bp.
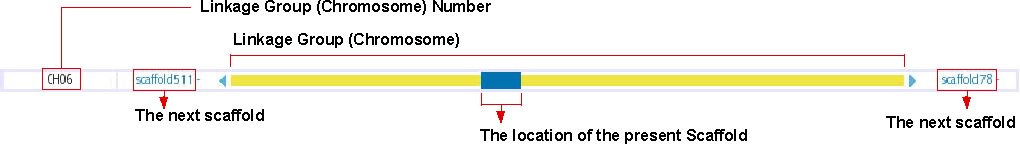
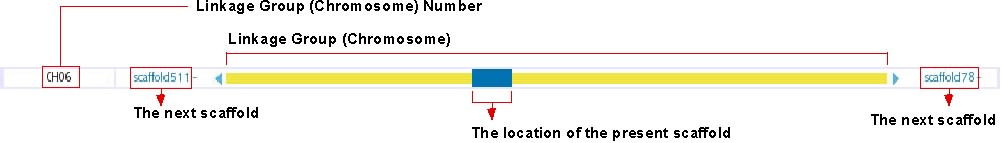
Chromosome Overview

This track shows the location of presently displayed scaffold on the chromosome. In the above image, for instance, the blue-colored box shows the position of scaffold100 on chromosome 6, which is represented in the yellow bar. Click on any position of this track will bring you to the chromosome view (see below). The next scaffolds are indicated at the both end of yellow bar. Click on the scaffold name shown in light blue to move to the view of the corresponding scaffold.
For chromosomal View (genetic map, see: http://trac.utgenome.org/project/UTGB/wiki/UTGBMedaka/Track#Chromosomalviewgeneticmap)
Base Color Track


Base color track changes the sequence to color mode. All four ATGC bases are displayed by converting to the individual color. It is natural to display each base pair by one pixel. By zooming in, you can see any specific region of the sequence in alphabet symbol (above bottom image).
It is also possible to customize the corresponding base pair color also. For example, if GC base pair are only colored then we can use it as a simple GC content track. To get the sequence itself, it is better to save from fasta track (http://trac.utgenome.org/project/UTGB/wiki/UTGBManual#Functionsofbuttons).
Ruler Track

Both the ruler track and the zooming track are displaying same contents with different color. These two show the base position number of the present displayed content with respect to the total sequence.
If you click any position of the ruler track, the viewpoint will move to the middle position. Before using the zoom button on main screen, it is better to have the required region on middle position by using the ruler track to smoothing future enlarge processing.
Quality Value Track

This track presents the quality value of medaka assembled sequences. The quality value of a subsequence in a scaffold can be viewed by inserting sequence’s scaffold name and location on main window.
Coverage Track

This track displays coverage ratio of a specific sequence from a scaffold, determined by aligning Plasmid read sequence on genome.
GC Content Track

This track displays the ratio of GC contents for 5 pixels. If the pixel number of a base pair is more than 5, the coloring will be done to tell whether it is GC or AT.
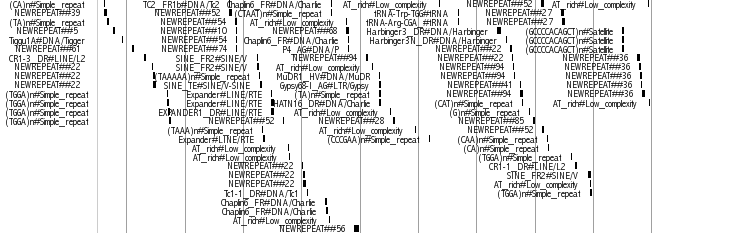
Repeat Masker Track

This track displays all the repeat elements in medaka genome fixed by repeatmasker(1), RepBase?(2) and de novo repeat finding tool(3). The repeat element’s region is displayed by a rectangular box.
reference
(1) http://www.repeatmasker.org/
(2) http://www.girinst.org/repbase/
(3) Kasahara et al., Nature 447:714-719 (2007)
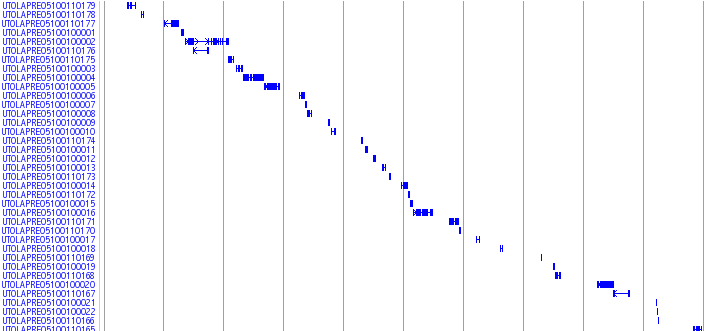
Bac End Track
A total of 142,414 bacterial artificial chromosome (BAC) end sequences are mapped to medaka genome. Three types of BAC library are of average size 135, 180, and 210 kb are used. The accession numbers of the reference BAC sequences are AB102768, BA000027, AB251575, and AB232918-24, respectively. To reduce computation time, the assembly was aligned against each reference BAC using BLAT with the default parameters, and the scaffold that was most similar to the reference was selected. The selected scaffold was then aligned to the reference BAC using NCBI-BLAST (The parameters were all default, except the e-value threshold was set to 1e-10)

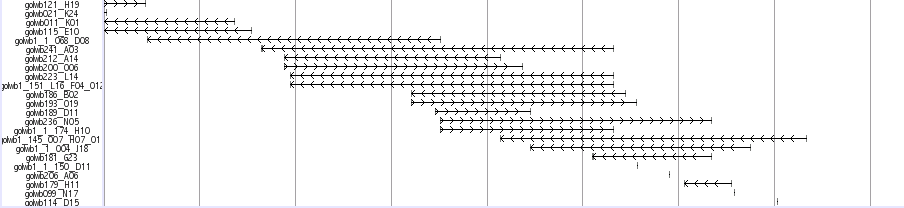
Fosmid End Track
About 35.5 and 37.5 kb length Fosmids were obtained at the National Institute of Genetics (NIG,Japan). Finally, 217,344 fosmid end pairs (11.1 x clone coverage) successfully located on the genome. Mapped fosmid is viewed in UTGB(medaka) main window named as “Fosmid end Track”

Libraries
GOLWFno0_xx -GOLWFno191_xx : 37.5 kb
GOLWFno192_xx-: 35.5 kb
This track displays all the mapped fosmid reads obtained at the National Institute of Genetics(NIG,Japan) by using rectangular box in a line.
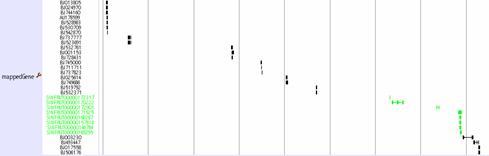
Genetic Marker Tracks
Three tracks provide genetic marker information of medaka genome.
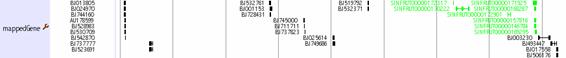
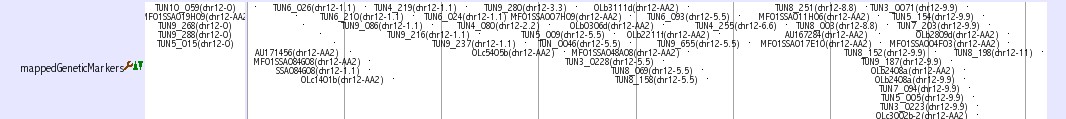
mappedGeneticMarkers
This track shows genetic markers which are used in medaka genome project (2, 3). Click on an individual marker within a track opens a table of typing data using Hd-rR/HNI female backcross panel.

Mbase marker
This track shows genetic markers which are shown in the Mbase in Prof. Mitani lab (1). Click on an individual marker within a track opens a link to Mbase (http://mbase.bioweb.ne.jp/~dclust/medaka_top.html).

SSLP Marker
This track shows 382 uniquely mapped SSLP (simple sequence length polymorphism) markers (4). Click on an individual marker within a track opens a details page containing primer sequences.

The details of these tracks are described here: http://medaka3.utgenome.org/~kobayashi/UTGBmedakaHELP/GneticMarkers.html
Reference:
(1) Naruse et al., Genetics 154:1773-1784 (2000)
(2) Kimura et al., Mech. Dev. 121:915-32 (2004)
(3) Kimura et al., Gene 363 24-31 (2005)
(4) Kasahara et al., Nature 447:714-719 (2007)
HNI alignment Track

This track displays all the polymorphisms regions between medaka Hd-rR and HNI strain.
In addition to the genome of the Hd-rR medaka inbred strain, the genome of another inbred strain HNI was also sequenced to produce the draft 648-Mb HNI genome. Inbred strains Hd-rR and HNI originated in the southern and northern Japanese populations, respectively. They can mate and produce healthy offspring, although they are estimated to have diverged about 4 million years ago, and their genome sequences have diverged by approximately 3.42%. The alignment of the two medaka genomes identified about 16.4 million single nucleotide polymorphisms (SNPs), from which 2,401 SNPs were selected and mapped genetically onto medaka chromosomes using a backcross panel between these two inbred strains.
The alignment of the Hd-rR and HNI genomes revealed 16,519,460 SNPs and 2,859,905 insertions/deletions (indels), and the locations of individual SNPs and indels are given in the web database. Pink indicates matched bases, while mismatches are highlighted by green, yellow, blue, and red that represent A, C, G, and T, respectively, in the HNI genome. Cyan indicates the two possibilities, deletions from the HNI genome or insertions into the Hd-rR genome, though the settlement requires comparison with the genome of an outgroup of Hd-rR and HNI. Gray means the failure of the alignment because of low quality bases in either of the two genomes or lack of HNI reads in the region.
The details of this track is described here: http://medaka3.utgenome.org/~ssksn/HNI_SNPs/common/HNI_SNPs_description.html
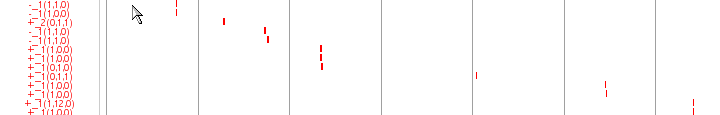
5’SAGE Track

This track displays the medaka expression profile by showing mapped 5’end tag of an expressed Gene. The positions of individual 5’SAGE tags are illustrated by red boxes. The label associated with each 5’SAGE tag is of the form S_F (L0, L1), where S indicates whether the tag is derived from the sense (+) or the antisense strand (-), F is the frequency of occurrences of the tag in the collection from a mixture of cDNA, and L0 (L1, resp.) is the number of loci where the tag is aligned to the genome with no mismatch (with one mismatch). Tags are aligned to unique positions if L0=1, or L0=0 and L1=1. For example, a tag labeled with +_5(1,3) is aligned uniquely to the plus strand of the position, it is observed five times in the tag collection, and it is also aligned to three other locations with one mismatch. A tag with -_1(0,1) fails to map to the genome with no mismatch but maps uniquely to the minus strand of the position with one mismatch. The figure displays a large number of 5’SAGE tags are observed in both strands.
Predicted Gene Track

This track displays the medaka predicted genes as Mapped gene track. It is viewed on lines, where the exons parts are on rectangular shape. Arrow sign shows the plus or minus strand of the genome.
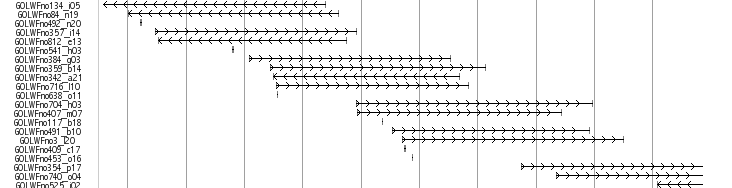
Medaka Trasncripts
![]()
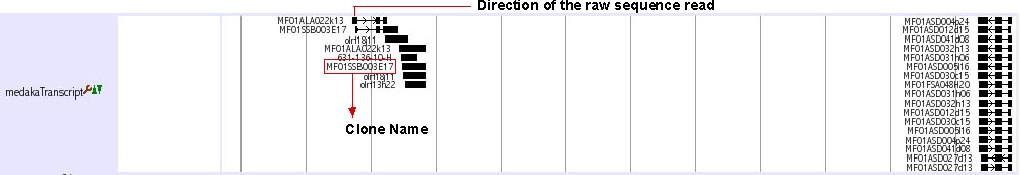
This track shows a total set of medaka transcripts from Unigne database build#19 in ncbi. Transcripts are initially aligned using BLASTN and listed the scaffolds which show the best match. The final alignments were produced between transcripts and the selected scaffolds using sim4, a program to align cDNA and genomic DNA (ref. 1). In some case, transcripts are mapped to unexpectedly huge region because of the low complexity sequences in the transcripts. We eliminated these regions when the mapped region is over 200 kb.
Black-colored boxes indicate aligned regions and bars indicate gaps. Arrows indicate the transcription directions. Click on each transcript opens a link to the information in the NCBI nucleotide database.
ESTs and mRNAs are represented by the clone names and gi numbers, respectively.
Reference: Florea et al., Genome Res., 8: 967-974 (1998).
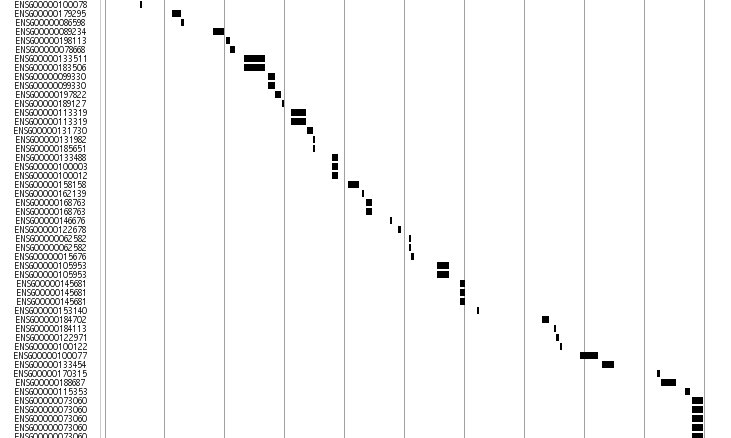
Ensembel Predicted gene Track

This track displays medaka genes predicted on Ensembel(ref) pipe line. The gene region is displayed by line and the bac ends are shown in rectangular box. The arrow sign shows the plus or minus strand of the genome.
This track is an alias of the Ensembl transcript model predictions in http://www.ensembl.org/Oryzias_latipes/index.html Ensembl Medaka. The mapping region for the gene is displayed by line and the exons are shown in rectangular box. The arrow shows the direction of the predicted transcript.
The current data sources are Ensembl44.
Click each transcript for more imformation in Ensembl.
Mutant_Track

This track shows reported medaka mutants. Click on each mutant opens a link to PUBMED in the NCBI.
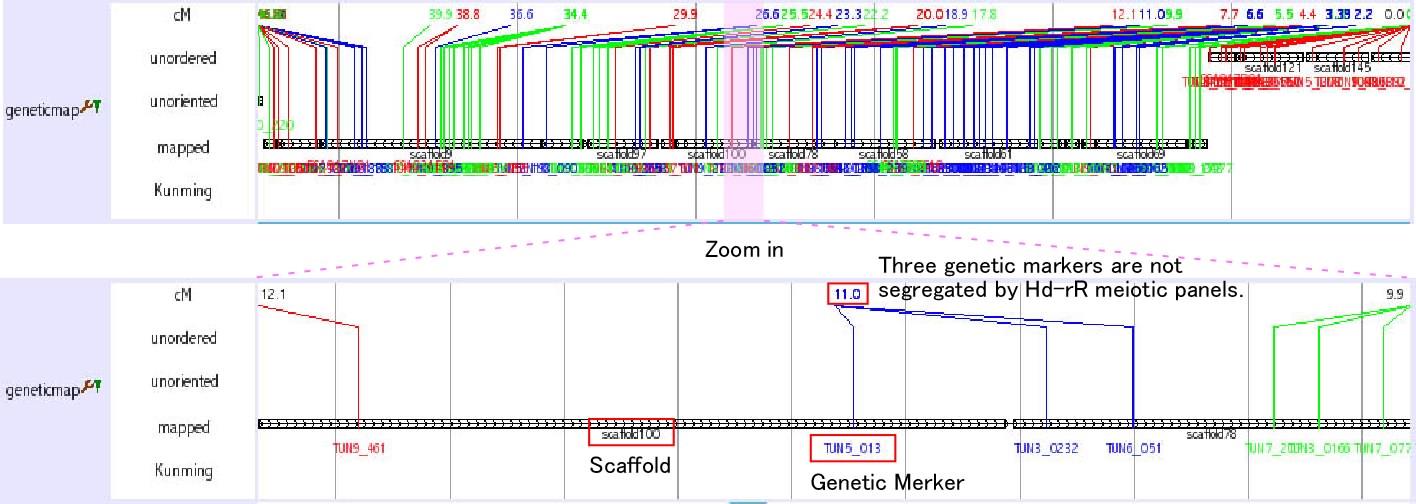
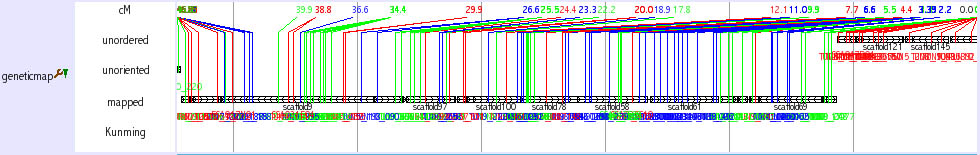
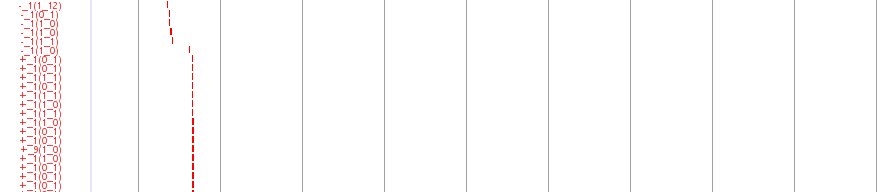
Chromosomal view (genetic map)

This track is not a regular track in the main window. This track opens when you search chromosome from keyword seach (select medaka-chr). You can also access this track from Chromosome OverView? track (see above) as a link. This track shows the relationship among chromosome, scaffolds and genetic markers.
The initial view is very busy, however, you can zoom into any region. It is also helpful to set width large, such as 10000. As shown in the figure below, you can obtain the information how the neighbouring scaffolds are ordered by genetic markers. Genetic distances among the genetic markers are shown. The color of the lines which represent genetic markers is changed where recombination is observed between the neighbouring markers.
There are three types of scaffolds, unorderd, unoriented and mapped. Unorderd means the cluster of the scaffolds. These scaffolds are not segregated by genetic markers and mapped on the same region. Unoriented means the sololy mapped scaffold without the directional information. Mapped means the scaffold that is sololy and directionally mapped scaffolds. If two scaffolds are linked by sigle BAC clone and it is consistent with genetic marker inforamation, two scaffolds are shown to be connected with horizontal line (ultracontig). Kunming means a typing panel only used to map scaffolds on chromosome 11.

Click on the scaffold name or genetic marker name to see the corresponding scaffold or genetic marker information, respectively.
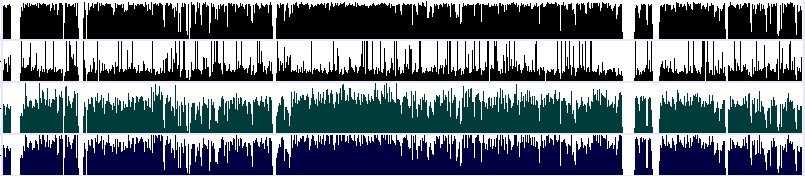
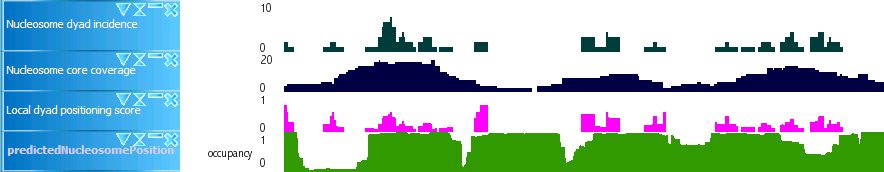
Nucleosome

Nucleosome dyad incidence: Number of putative nucleosome dyads in the region within a full turn of the helix (11bp) distance from the position
Nucleosome core coverage: Number of putative nucleosome cores that intersect with the region defined above
Local dyad positioning score: "Nucleosome dyad incidence" divided by "Nucleosome core coverage"
Predicted nucleosome position: Nucleosome occupancy predicted by the method proposed in E. Segal et al., Nature 442, 772 (Aug 17, 2006).
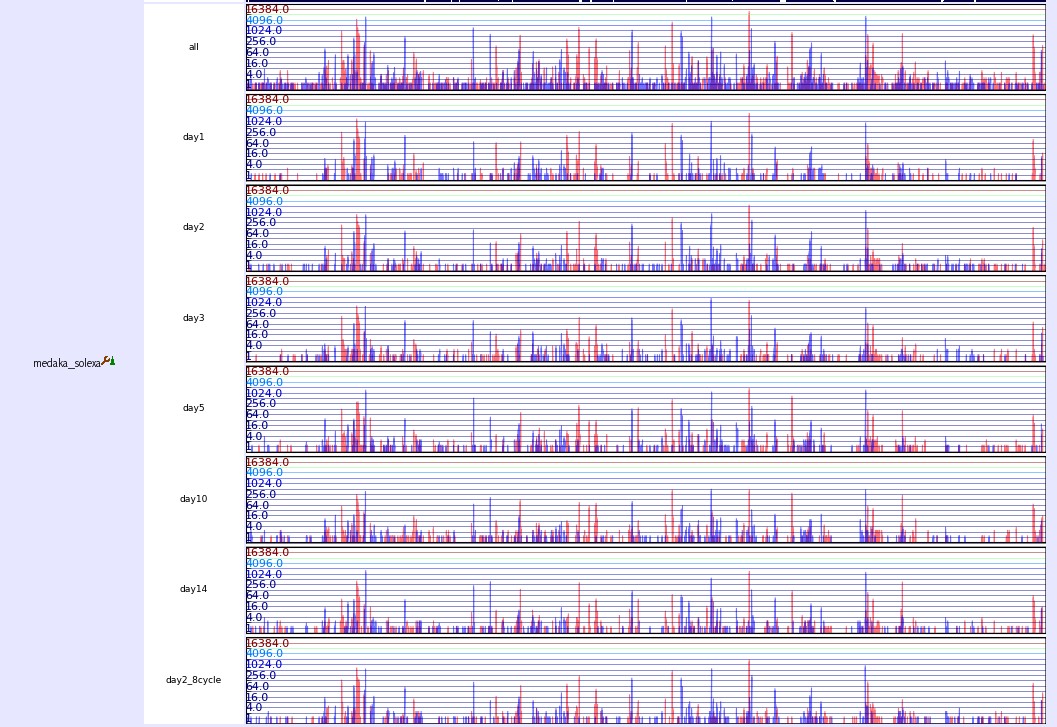
Expression

This track shows mRNA expression from different development stage. The expression number is counted by collecting 26bp short tags from 5end of mRNAs. After aligning tags to the medaka version1.0 genome, we select those tags which have unique loci and counted their copy number as the number of expression. Red and blue bars, respectively, present the numbers of tags in the plus and minus strands.
Attachments (57)
- MedakaTrasncripts.html (1.5 KB) - added by 18 years ago.
- ChromosomeOverView.html (1.3 KB) - added by 18 years ago.
- ChrView2.jpg (155.5 KB) - added by 18 years ago.
- ChrView.jpg (78.7 KB) - added by 18 years ago.
- ChrViewZoom.jpg (36.2 KB) - added by 18 years ago.
- EnsenblPredGene.html (898 bytes) - added by 18 years ago.
- GeneticMappingPanel & Markers.html (4.8 KB) - added by 18 years ago.
- GeneticMappingPanel & Markers.2.html (4.8 KB) - added by 18 years ago.
- EST_libraries.htm (8.2 KB) - added by 18 years ago.
- image028.jpg (3.3 KB) - added by 18 years ago.
- image029.jpg (2.2 KB) - added by 18 years ago.
- image030.jpg (2.1 KB) - added by 18 years ago.
- image031.jpg (742 bytes) - added by 18 years ago.
- image034.jpg (976 bytes) - added by 18 years ago.
- image035.jpg (3.5 KB) - added by 18 years ago.
- image036.jpg (5.9 KB) - added by 18 years ago.
- image037.jpg (29.4 KB) - added by 18 years ago.
- image038.jpg (7.0 KB) - added by 18 years ago.
- image039.jpg (4.8 KB) - added by 18 years ago.
- image040.jpg (1.8 KB) - added by 18 years ago.
- image032.jpg (3.0 KB) - added by 18 years ago.
- image033.jpg (3.0 KB) - added by 18 years ago.
- track_overview.png (3.3 KB) - added by 18 years ago.
- 5sage.png (243.2 KB) - added by 18 years ago.
- bac.png (610.5 KB) - added by 18 years ago.
- coverage.png (78.6 KB) - added by 18 years ago.
- fosmid.png (404.1 KB) - added by 18 years ago.
- homo.png (940.0 KB) - added by 18 years ago.
- pred.png (697.8 KB) - added by 18 years ago.
- qv.png (83.0 KB) - added by 18 years ago.
- repeat.png (511.7 KB) - added by 18 years ago.
- hni.png (26.9 KB) - added by 18 years ago.
- EnTra.jpg (17.7 KB) - added by 18 years ago.
- Entra.jpg (17.7 KB) - added by 18 years ago.
- Entra.2.jpg (59.1 KB) - added by 18 years ago.
- geneticmarker.jpg (39.7 KB) - added by 18 years ago.
- MedakaTranscriptsSc150.jpg (31.2 KB) - added by 18 years ago.
- homo.jpg (77.9 KB) - added by 18 years ago.
- SSLP.jpg (8.5 KB) - added by 18 years ago.
- Mbase.jpg (15.3 KB) - added by 18 years ago.
- ff.png (183 bytes) - added by 18 years ago.
- OverView.png (27.7 KB) - added by 18 years ago.
- chr_scroll.2.jpg (372.0 KB) - added by 18 years ago.
- chr_scroll.jpg (265.0 KB) - added by 18 years ago.
- ChromosomeOverView.jpg (25.9 KB) - added by 18 years ago.
- Mutant.jpg (5.0 KB) - added by 18 years ago.
- ChromosomeOverView2.jpg (24.9 KB) - added by 18 years ago.
- ChromosomeOverView3.jpg (24.9 KB) - added by 18 years ago.
-
5sagenew.jpg (11.1 KB) - added by 18 years ago.
5psage track file
- BAC.png (14.4 KB) - added by 18 years ago.
- BAC2.png (14.4 KB) - added by 18 years ago.
-
expression.jpg (219.5 KB) - added by 18 years ago.
Expression track image
- nucleosome.jpg (61.8 KB) - added by 18 years ago.
- nucelosome.2.jpg (73.5 KB) - added by 18 years ago.
- nucelosome.jpg (73.5 KB) - added by 18 years ago.
- nucelo.jpg (73.5 KB) - added by 18 years ago.
-
nucleosome.2.jpg (23.1 KB) - added by 18 years ago.
Sample of nucleosome tracks