| Version 42 (modified by , 18 years ago) (diff) |
|---|
UTGB Manual
- UTGB Medaka http://medaka.utgenome.org/
Track Information
Welcome to http://utgenome.org/ UTGB (University of Tokyo Genome Browser). With this browser you can browse genomic information of a target species (at present Medaka only) from several aspects. For example, the following tasks can be performed with different combinations.
- You can search gene, by gene name, clone name, cluster name and display its surroundings gene groups.
- You can map a genomic sequence to any genome and observe its surroundings.
- You can save the sequence itself on your system from here.
Questions, suggestions or comments are welcome to annotation at mlab.cb.k.u-tokyo.ac.jp.
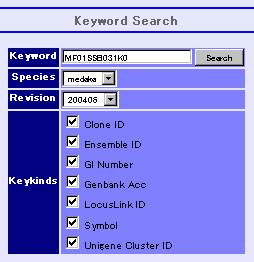
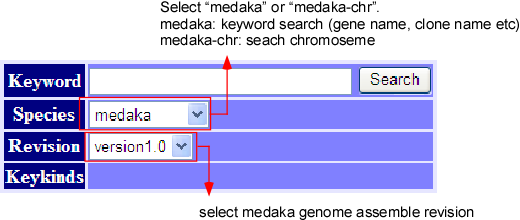
Keyword Search

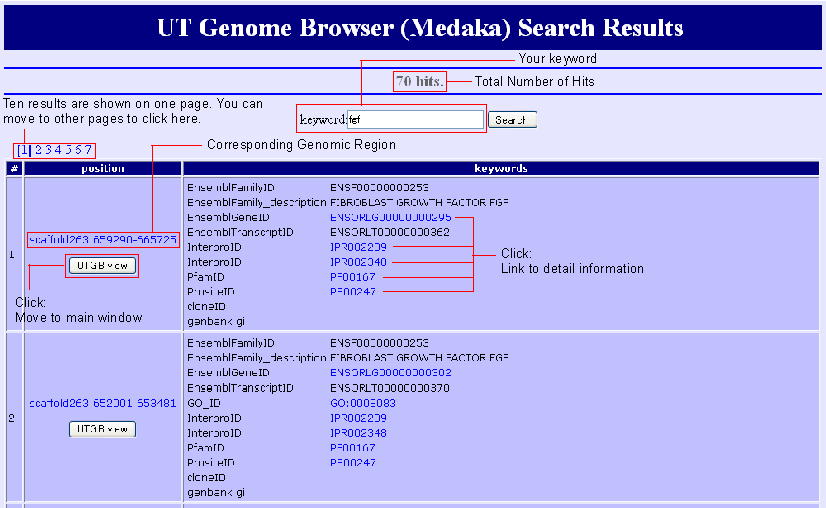
The top window displays the keyword search engine, as above picture illustrates. Inputting any keyword at the query box, we can see the detail information about the query. More about keyword search can be found in the help, written on the same window. In addition, if the keyword is a part of targets, then all the targets will be displayed. For example, the keyword “BCD” will match to “ABCD”, “BCDE”, “BCD” and “BCDF” etc. (this is worked out with using a suffix array.)
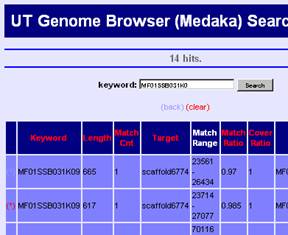
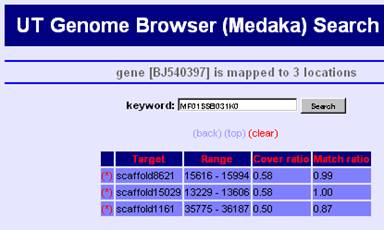
Search Result

Search results are listed by the genomic region because all kywords are connected via regions on the genome. You can move to the mapped region by clicking "UTGBview" button. Hyperlinks are available to access detaled information of some keywords.
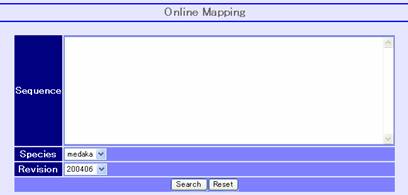
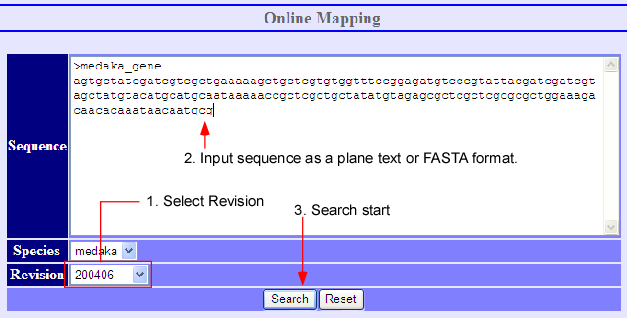
Sequence Alignment

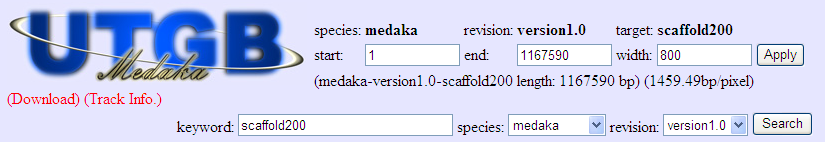
Sequence mapping is possible by inputting a sequence in the online mapping frame (above image) at the bottom of the main window. After selecting the species and its revision, press the search button on the bottom. The request is sent to the alignment server ALPS to align the given sequence to the selected genome. Afterwards, the list of alignment results is returned if the system finds some alignments.

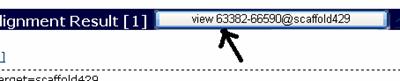
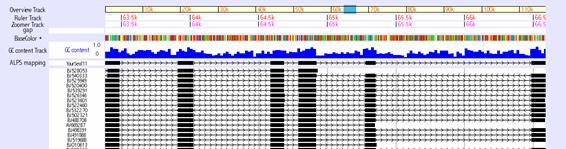
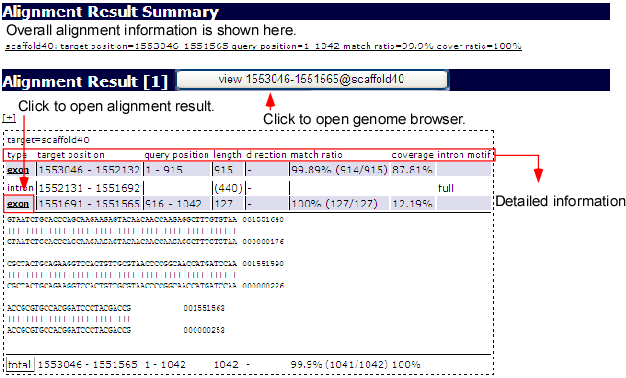
From the list, you can select one alignment by clicking the result button as illustrated above. Then, the aligned result will appear on the browser. The ALPS mapping track in following snapshot displays the added mapping status.

Main Window

The above picture shows the general information about the operation of UT Genome Browser.
In what follows, we describe the detail about each function.
Scrolling and zooming the main window
On main window, it is possible to shift and to zoom in/out the present observing sequence. These tasks can be carried out by:
- Inputting value in the input box method.
- Using shifting button method.
- Using overview, ruler and zooming track method.
Inputting value in the input box method

You can input values into the input boxes (like above image) inside the main window. The details about this method are as follows,
- Species
- Select the species to display. The selectable revisions would be changed with respect to the species. At present, only Medaka is possible to be selected.
- Revision
- Select the revision of the target specie’s genome. The selecting topics will change with respect to the selected revision.
- Target
- Select the target region to be displayed, from the selected species and selected revision. In the case of 200406 revision of Medaka, only scaffold name (e.g. scaffold123) can be selected but not the chromosome name (e.g. chr10). Chromosome numbers will be available in our later revision.
- Start
- Select the start position from your targeted sequence to display. The number should be 1-origin (i.e. the starting point will be 1).
- End
- Select the end point from your targeted sequence to display. The number should be 1-origin. If the ending point is greater than the starting point then the display will be normal. Otherwise, the display will be reverse. In both cases, the ending base will be included in the displaying sequence.
- Width
- Input the width in terms of pixels for output track display. Input the value that is suitable for your vision. Normally, it is assumed that width is equal to the screen width. It is also possible to input the width as 10 times bigger than the screen width. In that case, it seems to be convenient to use the scroll of the browser.
After manipulating the previous items, press the “Apply” button to shifting to the desired position of the sequence.
Using shifting button method

Moreover, there is another method by using the button (like above image). Normally, the input box method is useful only when it is important to have the correct position of the sequence. As number must be supplied in this method, sometime this process is quit cumbersome. So we provide more intuitive methods for your convenience. So the buttons related to these methods are as follows,
- Shifting
 ,
,  ,
,  ,
, are buttons to shifting the sequence. Therr.png button scrolls sequence up to one screen size where the r.png button scrolls half screen to the left. The inverse buttons are for shifting to the right.


- Scaling
 ,
,  ,
,  ,
,  ,
,  ,
,  ,
, 


The  button does scaling down and the display will be half of the present size where
  button does scaling up and the display will be 2 times bigger than present size. The fractional form button specifies the scale directly. The scaling unit is 1bp/pixel. For example,
  means 1 bp is displayed by 1 pixel, whereas
  means 10 bp is displayed by 1 pixel. So
  means the scale that enlarges the display up to the base level. zoom0001x.png is a scale ratio useful in displaying 1M bps on the screen. At the time of scaling up or down the view points of the present display will be remained unchanged.
Using overview, ruler and zooming track method
In addition, there are some methods to shifting. These are overview, ruler, zooming trucks. You can shift the viewpoint by clicking any position of these tracks. For details, please refer to the respective details about the each track.
Functions of buttons

- (rev)
- You can display the sequence in reverse mode by UT Genome Browser. Normally a sequence is displayed from left to right but you can reverse it with the (rev) button. An alternative way to display in reverse way is to input “start” value greater than “end” value in the Input Box. The same task can be done easily by clicking the (rev) button. As the (rev) button reverses start and end points of the present displayed sequence so this can change the display mode from normal to reverse or vice versa. If you press the (fasta) button on reverse mode, then the complementary strand of displayed strand will be retrieved.
- (top)
- By pressing this button you can return to the main screen. Information about present displayed range, track and each track setting etc. will be preserved.
- (track)
- Addition, deletion, and rearranging can be performed by this button. Details description will be given later.
- (fasta)
- Present displaying sequence can be retrieved with this button in fasta format. You will be instructed to save as a file name. For example, Medaka-200406-scaffold429 (64587-66612). fasta
- (png)
- Screen shot can be retrieved with this button in PNG format. Click to open the screen shot, and then save the image by right click and save. In some browser, the image will be saved as a BMP format.
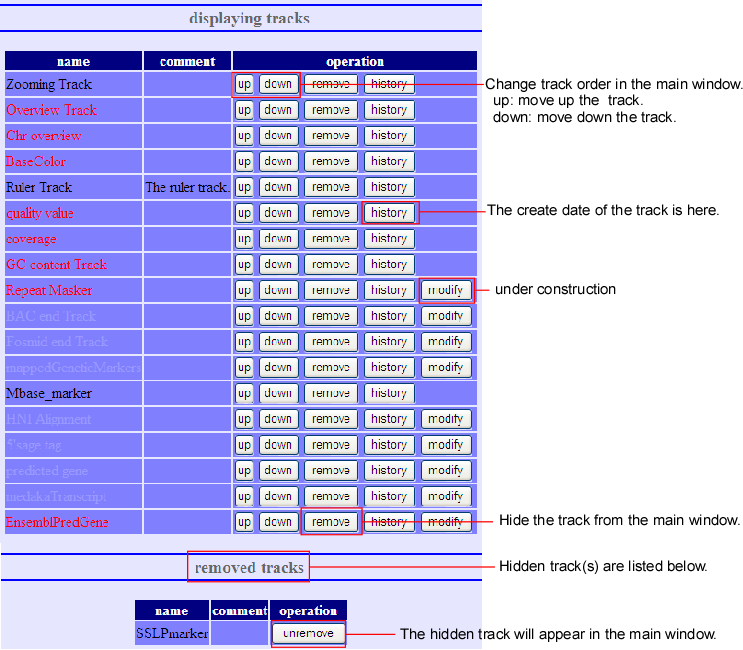
Addition, Deletion, and Rearrangement of Tracks

When the (track) button of the main screen is pressed, the above track-editing screen will pop up. Here you can do addition, deletion and rearrangement of the tracks. This editing screen can be divided into three parts - displaying tracks, removed tracks, and adding new track.
- Displaying track
- Here, tracks’ deletion and rearrangement can be done to the present displayed screen. The deleted tracks will be replaced to next removed track.
- Removed track
- This is the list of all tracks, which are deleted at Displaying Tracks. It is something like garbage bin. Undo-processing is possible for the tracks that are displayed here.
- Add new track
- New tracks, which are not available at present display, can be added by this track. By setting the URL of the new tracks, push add button. If the new tracks’ URL is read properly, the new tracks will be added after the present displayed tracks.
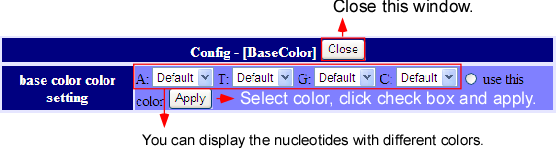
Setting for Tracks
On main screen, when the cfg.png button, beside the track name, is pressed, the display of that track can be customized as above image. The customizing contents of the tracks differ from each other. On the other hand, there are some tracks which contents cannot be customized at all. For details, please refer to the individual tracks information.
Display setting

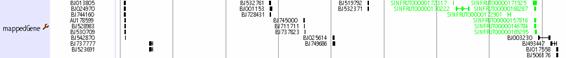
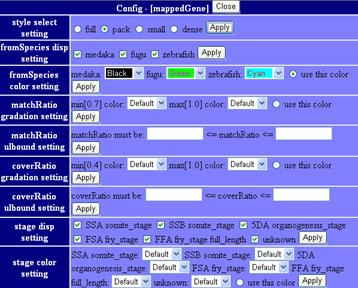
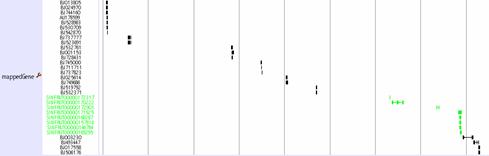
If the  button on the left side of Mapped Gene Track is pressed, the display setting windows will pop up. There are three parts of this setting; namely, changing the total display style, alternating the mapping results if a gene will be displayed or not, and modifying the color of a gene. The setting, whether to show or not, will display all which fulfill the conditions. The color setting can be done by “use this color” button beside the track.
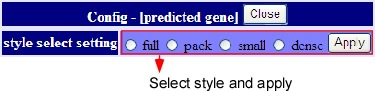
Style select setting
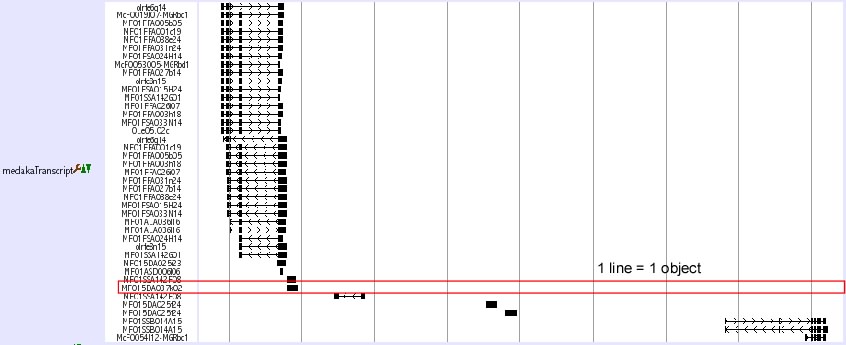
Predicted genes’ display setting can be changed here. There are four kinds of display style. These styles are full, pack, small and dense.
- Full
- In full style, each gene’s position is displayed on one line. On left side the Genebank accession number or Ensemble Gene ID is written.

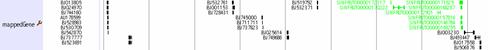
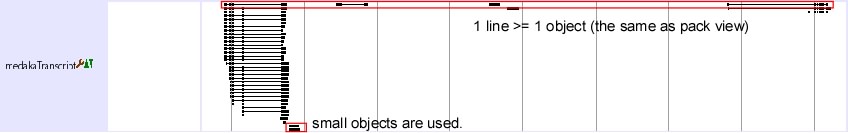
- Pack
- By showing individual alignments together with the names (Genebank Acc or Ensemble Gene ID) of genes on left side in multiple on one line, the pack style is more compact than full style.

- Small
- In small style, the up and down spaces for one gene are reduced to the minimum. Unlike the full style and the pack style, this does not display the names of the genes.

- Dense
- In this style, only the positions of aligned exons are displayed on one line.

At present except the full style, if the numbers of the mapped genes are more than 200 in a range of more than 50kbp, the graphical view of the genes will be displayed.
FromSpecies disp setting
Here we can set which species among Medaka, Zebra fish, Fugu’s mapping results are displayed or not. On default, all species results will be displayed. Only the species, which are checked on the Checkbook, will be displayed.
FromSpecies color setting
The color distinguishing for Medaka, Zebra fish, Fugu’s can be done here.
MatchRatio gradation setting
Gene’s color can be changed with respect to its match ratio. Provided colors for the match ratios 0.7 and 1.0 respectively, the system automatically gradates the coloring of the alignments between the lower and upper match ratios.
MatchRatio ulbound setting
You can specify the range of the mapping ratio by inputting the lower and upper bounds into the corresponding boxes. Alignments of match ratios within the range are only displayed.
CoverRatio gradation setting
Gene’s color can also be changed with respect to its cover ratio. Provided colors for the cover ratios 0.4 and 1.0 respectively, the system automatically gradates the coloring of the alignments between the lower and upper cover ratios.
CoverRatio upper/lower bound setting
You can specify the range of the cover ratio by inputting the lower and upper bounds into the corresponding boxes. Alignments of cover ratios within the range are only displayed.
Stage disp setting
- Here, you can fix which development stage’s expression EST should be displayed.
Stage color setting
- Color distinguishing can be done with respect to development stage.
Linkage for each gene
In full, pack and small style, each gene can be clicked on. By clicking each gene, you can see the details of this gene.
Ramen Assembler / UT Genome Browser Team Members
Ramen Genome Assembler Development Team
- Development of “Ramen” genome assembler and assembly of medaka genome:
- Masahiro Kasahara and Shin Sasaki
- Development of “Ramen Viewer” for genome assembly:
- Yukinobu Nagayasu
UT Genome Browser Development Team
- Design and development of UT Genome Browser, keyword search function, libraries for describing tracks:
- Yukinobu Nagayasu and Koichiro Doi
- Online mapping function for query sequences:
- Tomoyuki Yamada
- Comparative Genomics Track:
- Yoichiro Nakatani and Wei Qu
- Gene Prediction:
- Ahsan Budrul
- Mapped Gene Track:
- Yasuhiro Kasai
- Database access accelerators:
- Takehiro Furudate and Atsushi Mori
- Overall management:
- Koichiro Doi and Shinichi Morishita
Acknowledgements
This work has been supported by Grant-in-Aid for Scientific Research on Priority Areas (Grant#12209003) to Shinichi Morishita.
Ramen Assembler Development Team members are indebted to Yuji Kohara and Tadasu Shin-i for their technical discussions on the whole genome shotgun assembly.
Members in the UT Genome Browser Development Team are grateful to Kiyoshi Naruse, Daisuke Kobayashi, and Takanori Narita for their valuable input to improve the functions of the browser in a variety of ways.
Attachments (63)
- browser_main.png (34.5 KB) - added by 18 years ago.
- browser_moves.png (3.4 KB) - added by 18 years ago.
- browser_params.png (5.8 KB) - added by 18 years ago.
- browser_track.png (23.0 KB) - added by 18 years ago.
- cfg.png (715 bytes) - added by 18 years ago.
- f.png (723 bytes) - added by 18 years ago.
- ff.png (763 bytes) - added by 18 years ago.
- image001.jpg (13.5 KB) - added by 18 years ago.
- keyword_genes.png (15.0 KB) - added by 18 years ago.
- keyword_locs.png (17.9 KB) - added by 18 years ago.
- keyword_top.png (13.5 KB) - added by 18 years ago.
- online01.PNG (9.3 KB) - added by 18 years ago.
- online02.PNG (7.0 KB) - added by 18 years ago.
- online02.2.PNG (7.0 KB) - added by 18 years ago.
- online03.PNG (28.4 KB) - added by 18 years ago.
- r.png (730 bytes) - added by 18 years ago.
- rr.png (758 bytes) - added by 18 years ago.
- track_overview.png (3.3 KB) - added by 18 years ago.
- zoom0001x.png (802 bytes) - added by 18 years ago.
- zoom001x.png (801 bytes) - added by 18 years ago.
- zoom01x.png (787 bytes) - added by 18 years ago.
- zoom1x.png (779 bytes) - added by 18 years ago.
- zoom10x.png (786 bytes) - added by 18 years ago.
- zoomin.png (760 bytes) - added by 18 years ago.
- zoomout.png (759 bytes) - added by 18 years ago.
- rr.2.png (758 bytes) - added by 18 years ago.
- genescan.jpg (4.8 KB) - added by 18 years ago.
- comp.jpg (20.1 KB) - added by 18 years ago.
- image029.jpg (2.2 KB) - added by 18 years ago.
- image029.2.jpg (2.2 KB) - added by 18 years ago.
- image030.jpg (2.1 KB) - added by 18 years ago.
- image030.2.jpg (2.1 KB) - added by 18 years ago.
- image032.jpg (3.0 KB) - added by 18 years ago.
- image033.jpg (3.0 KB) - added by 18 years ago.
- image033.2.jpg (3.0 KB) - added by 18 years ago.
- image034.jpg (976 bytes) - added by 18 years ago.
- image035.jpg (3.5 KB) - added by 18 years ago.
- image036.jpg (5.9 KB) - added by 18 years ago.
- image037.jpg (29.4 KB) - added by 18 years ago.
- image038.jpg (7.0 KB) - added by 18 years ago.
- image039.jpg (4.8 KB) - added by 18 years ago.
- image040.jpg (1.8 KB) - added by 18 years ago.
- image041.jpg (1.5 KB) - added by 18 years ago.
- image041.2.jpg (1.5 KB) - added by 18 years ago.
- Main_Page.png (93.8 KB) - added by 18 years ago.
- Operation.png (54.1 KB) - added by 18 years ago.
- function_button.png (1.6 KB) - added by 18 years ago.
- align_result.png (21.1 KB) - added by 18 years ago.
- Online_mapping.png (13.8 KB) - added by 18 years ago.
- Online_mapping2.png (13.8 KB) - added by 18 years ago.
- ALPS.png (6.4 KB) - added by 18 years ago.
- keyword_top2.png (11.0 KB) - added by 18 years ago.
- browser_track2.png (62.5 KB) - added by 18 years ago.
- browser_track3.png (62.5 KB) - added by 18 years ago.
- BAC_Fosmid_config.png (33.4 KB) - added by 18 years ago.
- Basecolor_config.png (10.7 KB) - added by 18 years ago.
- full.jpg (48.3 KB) - added by 18 years ago.
- small.jpg (16.3 KB) - added by 18 years ago.
- pack.jpg (41.3 KB) - added by 18 years ago.
- dense.jpg (8.6 KB) - added by 18 years ago.
- Style_setting.jpg (11.9 KB) - added by 18 years ago.
- Search_Result.png (17.6 KB) - added by 18 years ago.
- Search_Result2.png (17.6 KB) - added by 18 years ago.
Download all attachments as: .zip